Background
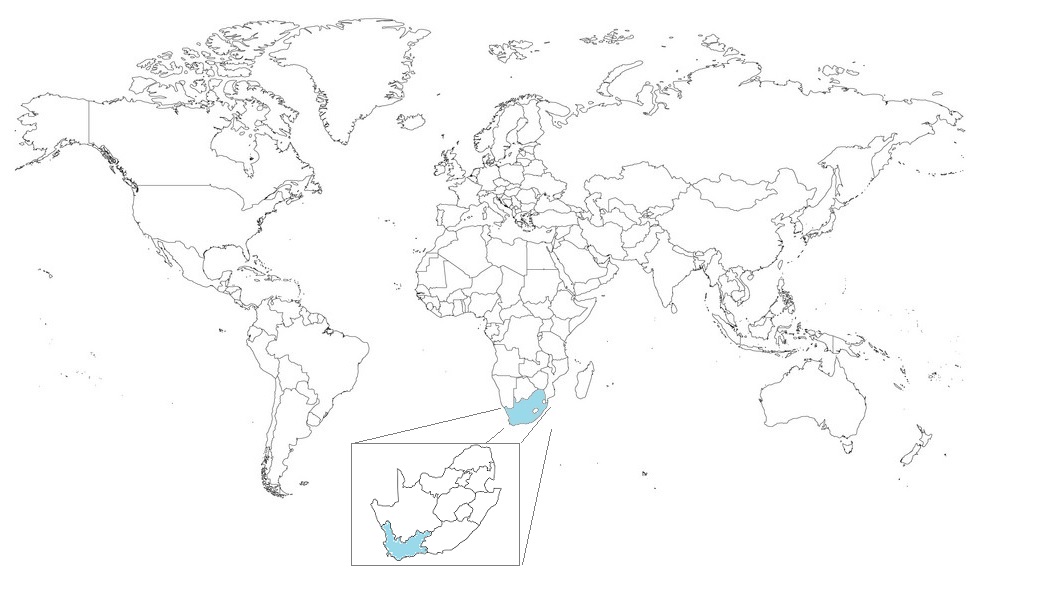
The need for urgent action with regard to water conservation was starkly highlighted in 2018 in the city of Cape Town, which is located in the Western Cape province of South Africa. The city experienced one of its worst prolonged periods of drought in 2018. The reality of the situation was that the water supply to the city of 4 million inhabitants was at risk of running out, if no effective water conservation strategies were to be implemented. This eventuality was referred to as Day Zero. Part of the City’s strategy to avert Day Zero was to minimise all water losses and to implement fair and equitable daily water rationing. The rationing was legislated at 50 litres per person per day.
Requirements
In situations of extreme drought where the need for strict water conservation are required, solutions and strategies are required that allow for effectively managed of the water resource. A primary requirement is therefor to provide current and accurate water usage data to enable this management. The requirement for detailed usage data is reliant on smart metering, which can be implemented through the use of smart meters or plug in type devices that convert conventional meters into smart meters.
This case study highlighting the benefits to be gained through the access to detailed usage data in terms of the following priorities:
- Minimise water loss.
- Rapidly identify water loss events.
- Fairly manage the allocation of the water available.
Data
Why is the need for accurate and current data at meter level so imperative? This can easily be illustrated using the 50 litre per person per day allocation as instituted by the City of Cape Town during the 2018 crisis. Based on this water restriction, in a dwelling housing 4 people, an 8.3 litre/hr leak would completely exhaust the household’s daily allocation, without any human consumption. Not identifying existing leaks makes the implementation of a strategy based on low daily water limitation, extremely problematic. Leaks need to be rapid identified and addressed.
The data presented in this case study has been based on daily meter readings from 2028 metering points, these being located in 25 separate sites. The overall statistics for the 2028 metering points were as follows:
| Sample | 2028 | meters |
| Period | 445 | days |
| Sites | 25 | units |
| Leaks | 15 | sites |
| Bursts | 8 | sites |
| Total water used | 199696 | |
| Total water lost | 1436 | |
| Lost water | 0.72 | % |
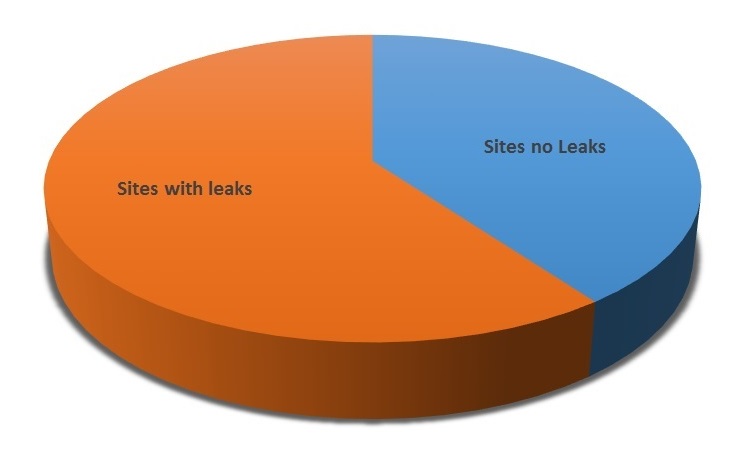
The above data analysis was limited to meters with a leak flow greater than 10 litres/hr.
Key Insight
Analysis of the 25 sites provided a number of key insights. The analysis differentiated between lost water due to Leaks and that due to bursts. Water lost to leaks was defined as flow rate between 10 – 100 litres/hour or 240 – 2400 litres/day, bursts were defined as flows greater than 100 litres/hour.
- The majority of the water lost was confined to a limited number of sites.
- The majority of the water lost to leaks, 61% was lost due to a small proportion of the dwellings with leaks. Twelve dwellings accounted for 60 % of all the water lost to leaks or 37% of all water lost.
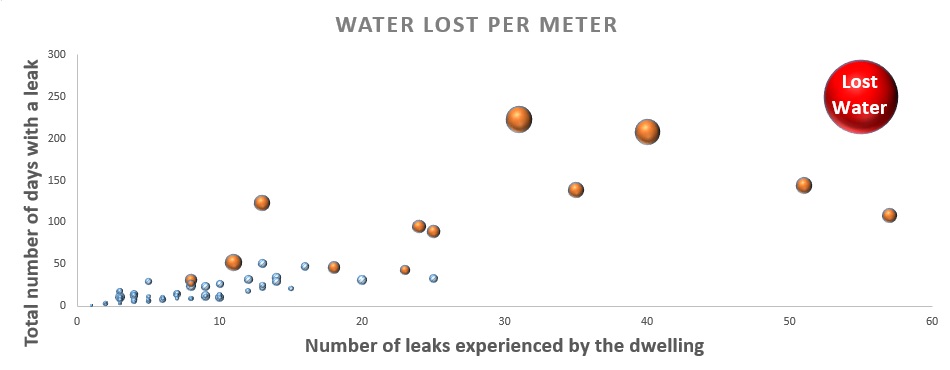
- The majority of the water lost occurred in dwellings that experienced multiple leaks, more than 10 leaks in the 443 day review period.
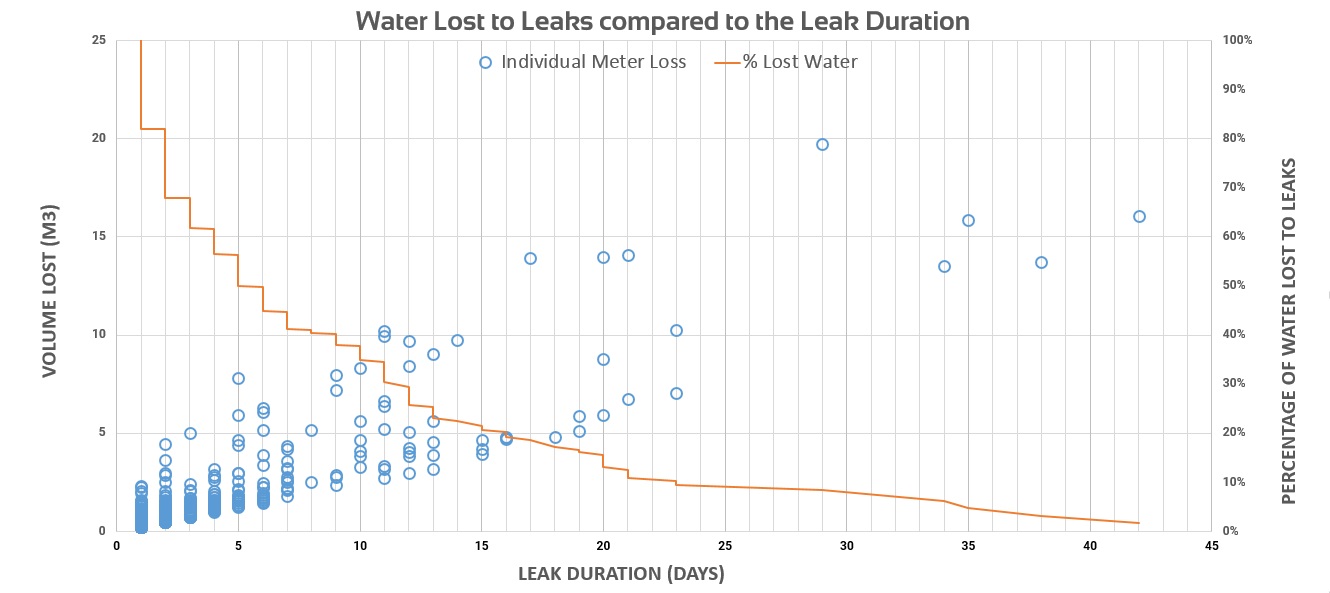
- Half the water lost to leaks was as a result of leaks that had a duration of less than 6 days. To achieve a 50% reduction in water lost to leaks, customer needed to repair the leak within 48 hours.
- Water loss due to burst, flow rates above 100 litres/hour, accounted for a third of all water lost
- The majority of the water lost to bursts, 54% occurred in bursts with a duration of 6 days or longer.
- A small number of dwellings (0.74%), accounted for a high percentage (34.5%) of the water lost to burst.
The above insights provide clear evidence that real-time and relevant meter reading data, provided by smart metering, allows for an efficient and targeted strategy to be setup that can effectively address the key priority of both minimising water loss and rapidly identify water loss events.
Leak Water Loss by Site
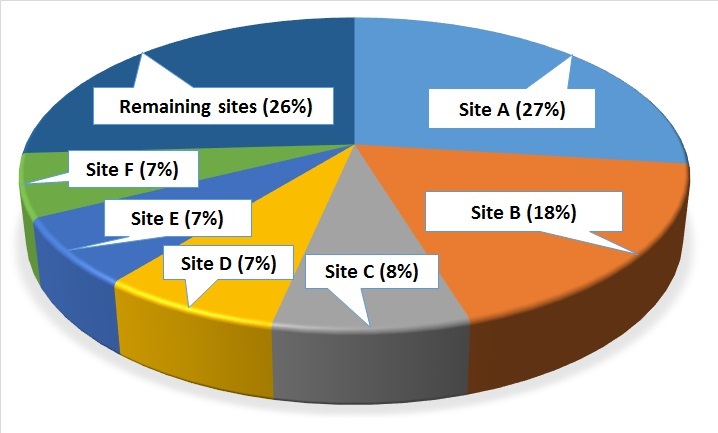
The deeper analysis of the water lost to leaks data, indicated that 6 sites accounted for 74.4% of the water lost to leaks, these 6 sites constituted 27.2% of the installed meter base. This insight provides a clear indication of where the water conservation strategies should best be targeted and applied.
Leak Water Loss by Meter
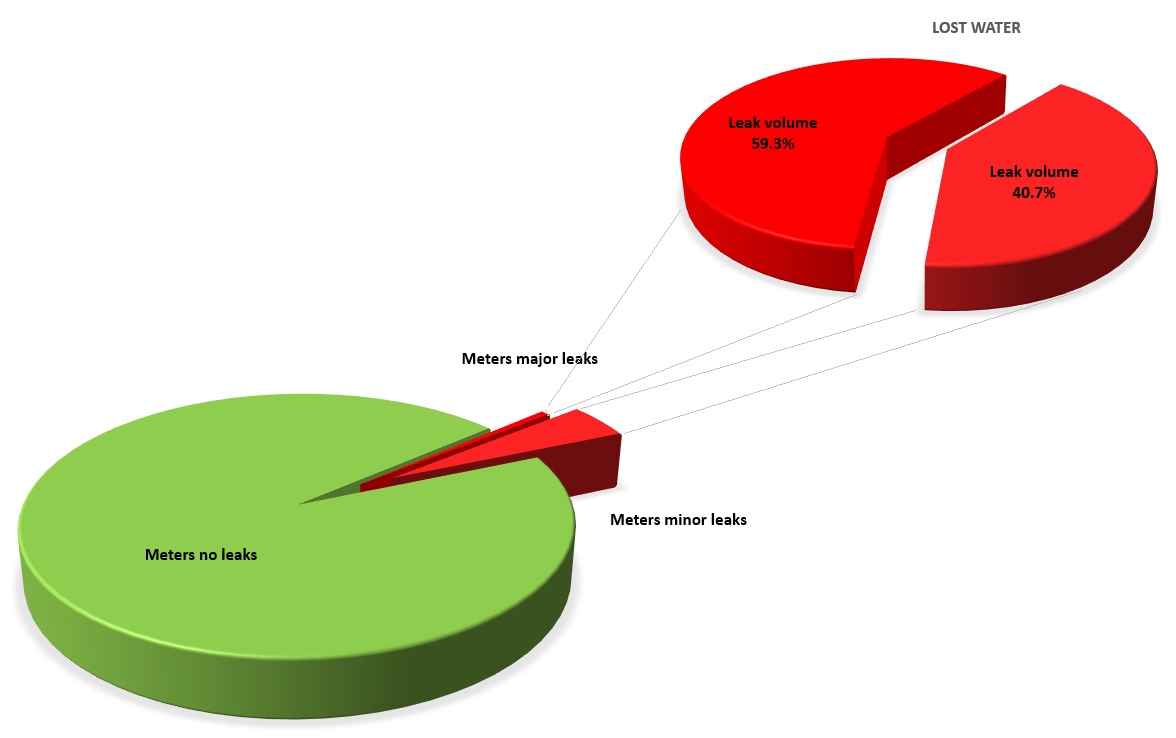
The analysis of the leak data at meter level indicated that of the 2028 meters installed a total of 111 meters or 5% had presented leaks during the review period. However further analysis of the data showed that only 12 meters or 0.6 % of the installed meters, in fact accounted for 59.3% of all the water lost to leaks. This level of in-depth information is a uniquely powerful tool in the strategy of water conservation as it provides a means for an extremely targeted response strategies. These type of strategies not only result in significant water savings, they also improve customer satisfaction and result in dramatically reduce labour costs.
Leak Characteristics
The analysis of the leaks data in terms of the leak characteristics such as volume lost, leak duration and frequency of leaks provided an interesting insight, and this is depicted in the graphic below. The graphic clearly indicates that the majority of the water lost was due to a few meters, that each had multiple leaks, resulting in many days of the water loss. In the graphic the Red sphere is a representation of all the water lost to leaks, the Orange depicts the water lost through the 12 worst dwellings with leaks and the Blue depicts the remaining 99 dwellings with leaks. The graphic represents a total of 2028 meters under review for 445 days located in 25 sites.
Leak Duration
Analysis of the data indicated to effectively address leaks within the system, the response time to detect the leak was critical. From the data 50% of the water lost to leaks occurred in leaks that had a duration of less than 6 days. The longest recorded leak was 42 days. Note this data only addresses leaks of 10 litres/hr and greater.
Burst Water Loss by Duration
The water losses attributed to water bursts, a burst being defined as the sustained flow of above 100 litres/hour, indicated that these accounted for 1/3 of all water lost. The analysis provided the insight that with a rapid response mechanism, that allowed for bursts to be identified and addressed within 48 hours, the water loss to bursts could be substantially reduced by a factor of 80%. This would constitute an overall 27% drop in all of the water lost to both leaks and bursts. The critical element with regard to water loss through bursts is the time required to respond and cut off the flow. The system must be extremely responsive to bursts.
System and Site Retic Losses
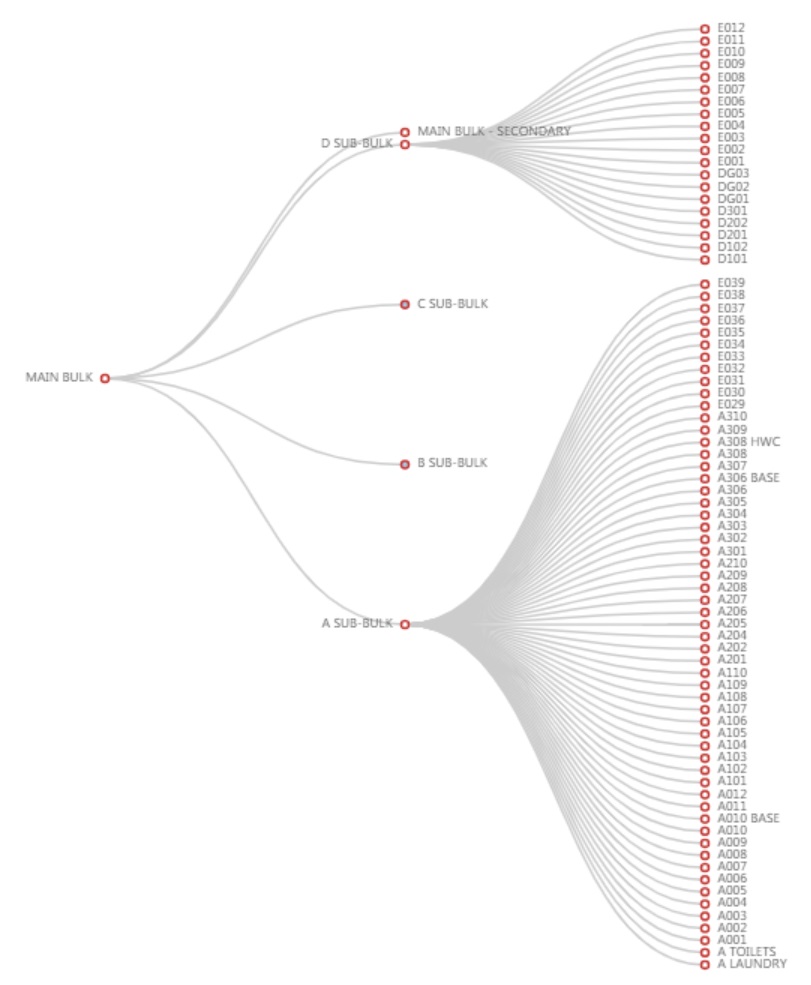
Too effectively address the losses within the reticulation, detailed water balances need to be performed. The
sites covered in this case study did not have bulk and sub bulk meters installed, and as such water loss within the reticulation have not been addressed, only losses after the customer meter have been considered. Daily time synchronised water balancing is a key element to fully implement a water conservation strategy.
Allocation
If water rationing is required, then to gain customer acceptance requires a fair and equitable solution. A solution based on retrospective penalties tied to the customers billing is inefficient, both in terms of the customer relationship as well as the desire to stabilise the water usage. The solution needs to be real time and customer focused. This requires smart metering with daily monitoring, coupled to mobile phone notifications. Preferably notifications that can be managed and setup on an individual basis per dwelling. Clearly policing of the usages is required and penalties retain their role in those cases where there is blatant disregard for the water utilities strategy.
Clearly there are benefits to a solution that quickly and in a responsive manner informs the customer on a daily basis of their usage, thereby allows them to quickly adjust their usage and remedy any discretion is preferred.
Key take away
Based on the data obtained from the 25 sites and reviewed in this case study, the core functional elements of the smart meter solution required to effectively implement a water conservation strategies needs to include:
- Rapid detection of leaks and bursts events.
- Effective customer notifications.
- Daily meter reading data is required.
- Robust and accurate water balancing is preferred.
- Daily threshold notification allow for a fair rationing strategy.
- Enhanced customer relationship
Disclaimer
The information contained in this case study is provided as is and without any warranties of any kind, whether expressed or implied. The contents of this case study are provided as general information only.
